










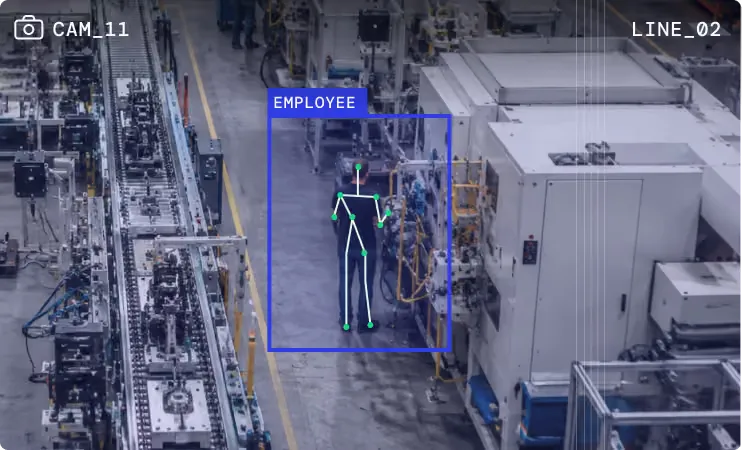
AI-powered analytics for manufacturing usually starts with a hunt for data: machine signals, lab results, spreadsheets. Quality has a shortcut. If a model already inspects every unit on the line, each inspection is a record with a defect type, a size, a position and a timestamp.
Tristar’s analytics are built on that record. They cover what cameras see: product defects and what happens on the line. They aren’t a generic BI layer or a predictive maintenance suite, and we’d sooner say so up front.
Every inspected part is a data point
Sampling gives you a few measurements per shift and a lot of inference. Full inline inspection gives you the whole population. Trends rest on everything the cameras saw, not on a sample.
Each record carries enough context to be sliced later: the line, the tool or cavity where that applies, the lot and the time. On web lines the record also carries the position along and across the roll.
This is the base for manufacturing quality analytics that engineers trust. They can open any point on a chart and see the image behind it. If you’re new to the inspection side, what AI visual inspection is covers how those records get made.
Questions the AI analytics answer
Different roles ask different things of the same dataset.
| Who asks | The question | The view that answers it |
|---|---|---|
| Process engineer | Which tool or cavity is producing this defect? | Defect rate by tool and cavity |
| Plant manager | Is one shift scrapping more than the others? | Defect and scrap trend by shift and line |
| Quality manager | What did we ship in that lot? | Lot record with defect images, sizes and times |
| Converting or extrusion lead | Where on the roll is the problem? | Roll map with defect location and size |
| VP of operations | Which lines need attention this month? | Leadership dashboard |
| Auditor or customer | How do you know the system is right? | Validation set with detections, misses and false rejects by defect type |
From a defect trend to a root cause
A chart doesn’t fix anything. The routine around it does.
Spot the pattern
A defect type starts climbing on one line, or clusters at one position across the web. An alert goes out if the rate spikes.
Narrow it down
Break the same defect out by tool, cavity, shift and lot. A problem tied to one cavity or one crew looks very different from one that's everywhere.
Look at the images
Open the defects behind the numbers. Shape and position often point to the cause: a damaged die, a dirty roll, a worn seal bar.
Fix and confirm
Make the change, then watch the same trend. If the rate comes down and stays down, the cause was right.
In a steel stamping deployment that worked this way, scrap began trending down within 120 days and fell 25%. The article on scrap reduction in manufacturing describes the method in more detail.
Feeding the process, not only the report
Some findings don’t need a person in the middle. Because the inspection result already goes to the PLC, it can adjust the process as well as reject the part.
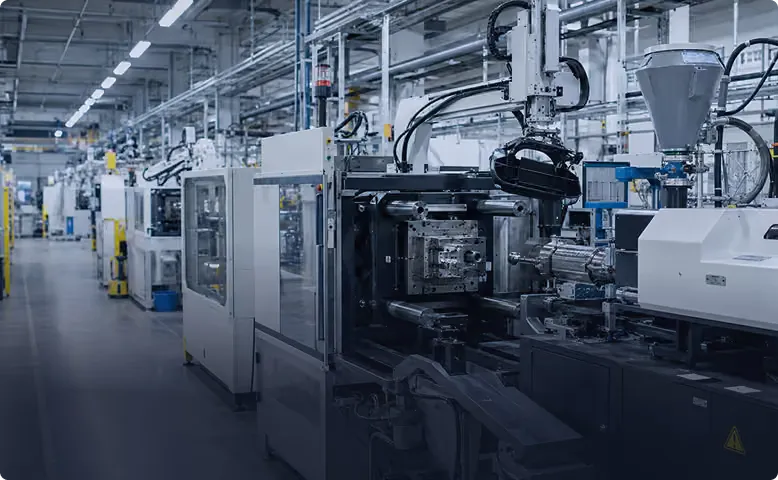
Injection molding gives a clear example. When parts begin trending off-shade, the system can prompt a color pump correction instead of waiting for someone to notice a bin of off-color parts. The article on injection molding defects explains the defect families involved.
That’s the honest extent of AI for manufacturing process optimization at Tristar: adjustments driven by what the cameras measure. It doesn’t model your whole process from machine parameters, and it doesn’t schedule production.
The weekly review
Analytics pay off when someone looks at them on a schedule. Tristar runs a short weekly review with your team after go-live. It has a fixed agenda:
- Anomalies the system flagged that didn’t match a known defect type.
- Detections, misses and false rejects by defect type, against the validation set.
- Tolerances that need tightening or loosening.
- Trends by line, tool and shift, and what was done about last week’s.
New defect types are added from the first item, so the dataset gets richer over time. The second item is your evidence that the numbers on the dashboard can be trusted.
What AI-powered analytics for manufacturing won’t do here
A short list of limits saves everyone time.
- No vibration, temperature or energy analytics. The input is images.
- No general dashboards for finance, supply chain or maintenance.
- No replacement for an MES. Tristar writes quality records to MES or ERP and leaves planning and genealogy to them.
What you do get is a complete, image-backed quality record for every line with a station on it. See AI visual inspection for the station itself, or scrap reduction for how the data is used to bring scrap down.
We can’t tell you what your trends will show before the cameras are on. Send us samples, and we’ll tell you what we find after we run your parts.